
One of Excel’s most powerful tools for analyzing financial and operational data is the PivotTable function. The following shows how to create a PivotTable and illustrates some of the functionality of the tool.
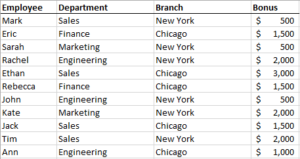
The below image is our initial data set. It shows each of ABC Company’s employees, their department, the office location they work from, and their 2016 bonus.
Management of ABC Company would like to be able to quickly review a table that shows bonus by department, as well as one that shows bonus by department and branch. This information could be obtained relatively quickly from this data set without an advanced function because we are using a small data set for this example. But if we start getting into hundreds of employees, you will see that a manual process would be very inefficient.
To create our PivotTable, select the entire data set, including the headers. Then go to Insert on the Ribbon Bar and choose “PivotTable”. You will then get the following dialogue box:

Because we already highlighted our data set, your Table/Range should be showing properly. If not, you would just need to correct that information by either typing in the selection or highlighting the data set in the excel sheet. Then you can either choose to create a new worksheet with the Pivot Table, or choose to create the table on your existing worksheet. Once we click “OK”, we have our PivotTable created and now need to modify the fields of the table itself. To modify the fields, we can either check the boxes next to the fields, or drag the fields into the different areas (see below – filters, columns, rows, values). To create a table that shows bonus by department, we will want the Department to be under Rows, and the Bonus to be under values, which will look like the following:

Once these settings are selected, we should now have a succinct and summarized table to present to management, as follows:

To create our table that shows bonus by department and branch, we could then move the Branch field into Columns, and our table will appear as follows:

We have now quickly created both tables requested by management. As you come across very large data sets and data sets with more columns and different variables, you can try creating your own PivotTables to summarize the data and help with performing various types of analysis.